What is Clustering?
•Definition:The fundamental task of grouping a set of objects (documents) such that objects in the same group (cluster) are more similarto each other than to those in other groups.
•It is the most prevalent form of unsupervised learningin IR.
•Goal:To achieve high intra-cluster similarity(documents inside a cluster are highly similar) and high inter-cluster dissimilarity(documents in different clusters are highly dissimilar).
•Contrast with Classification:
•Classificationis supervised: documents are assigned to predefined, known classes (labels).
•Clusteringis unsupervised: the classes (clusters) are discovered fromthe data.
What is Clustering?
- Definition:The fundamental task of grouping a set of objects (documents) such that objects in the same group (cluster) are more similar to each other than to those in other groups.
- It is the most prevalent form of unsupervised learning in IR.
- Goal:To achieve high intra-cluster similarity(documents inside a cluster are highly similar) and high inter-cluster dissimilarity(documents in different clusters are highly dissimilar).
- Contrast with Classification:
- Classification is supervised: documents are assigned to predefined, known classes (labels).
- Clustering is unsupervised: the classes (clusters) are discovered from the data.
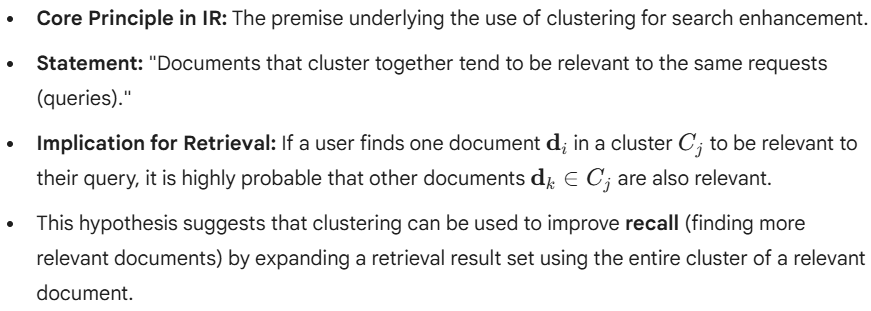
The Cluster Hypothesis
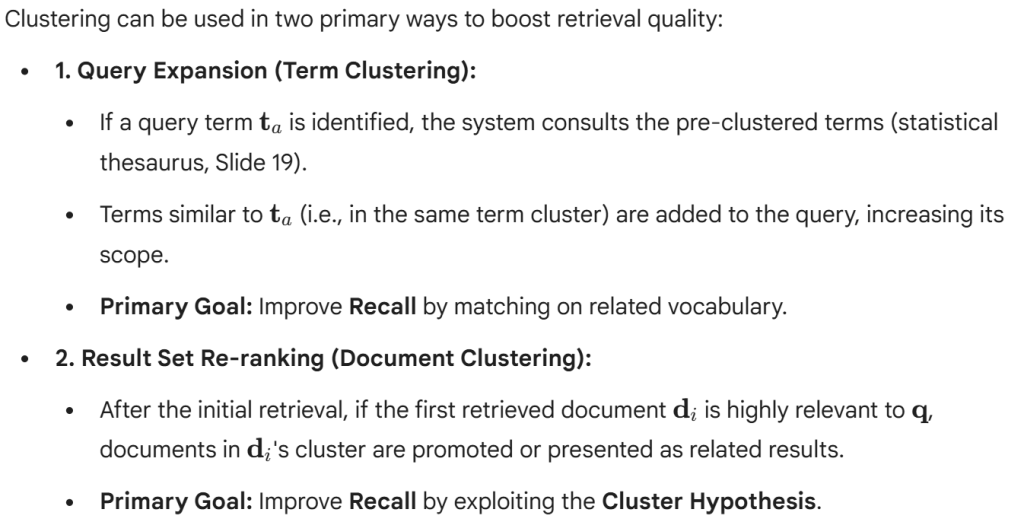
Why Cluster Documents? (I: User Interface)
1. Organizing Search Results (Post-Retrieval Clustering):
- Clustering is performed on the top 50–100 documents retrieved by a standard ranking function.
- Purpose:To provide a summary or topical categorization of the result set.
- Benefit:Users can quickly grasp the diverse themes/topics present and navigate to the most relevant group.
- Example:Tools like Scatter/Gather or modern clustered search engines (e.g., Vivísimo) group results with auto-generated labels (e.g., “Amazon River,” “Amazon E-Commerce,” “Amazon Rainforest”for the query “Amazon”).
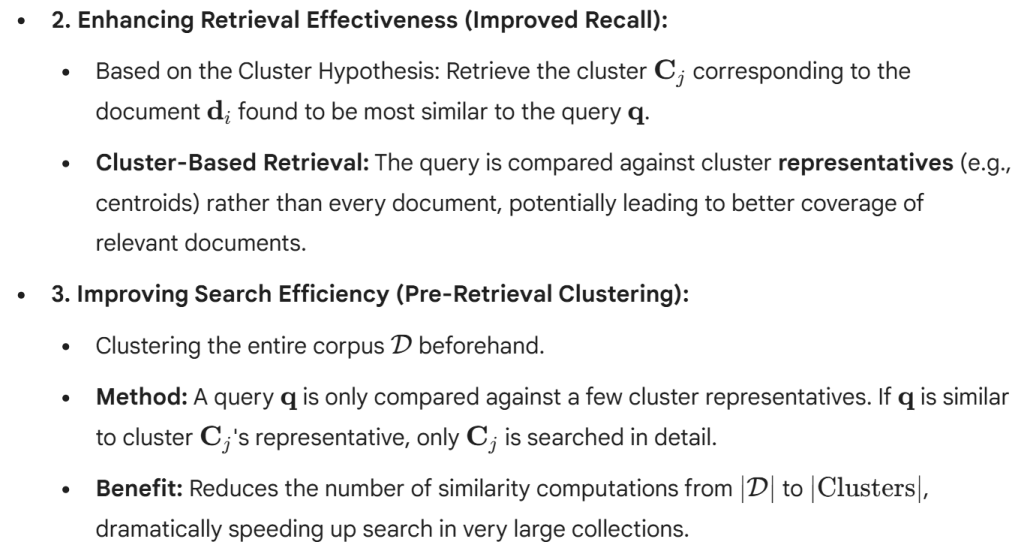
Why Cluster Documents? (II: System Efficiency & Effectiveness)
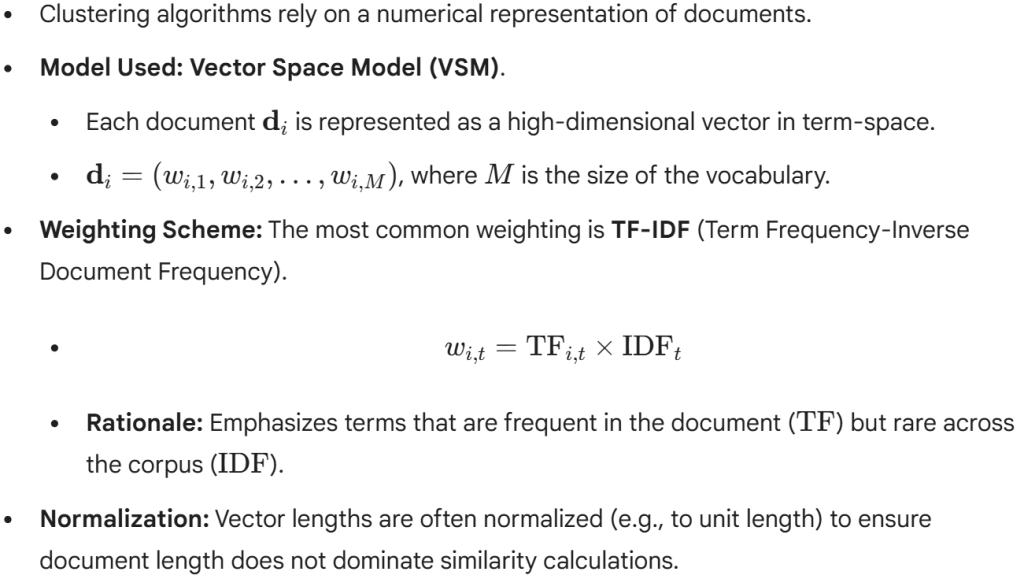
Document Representation for Clustering
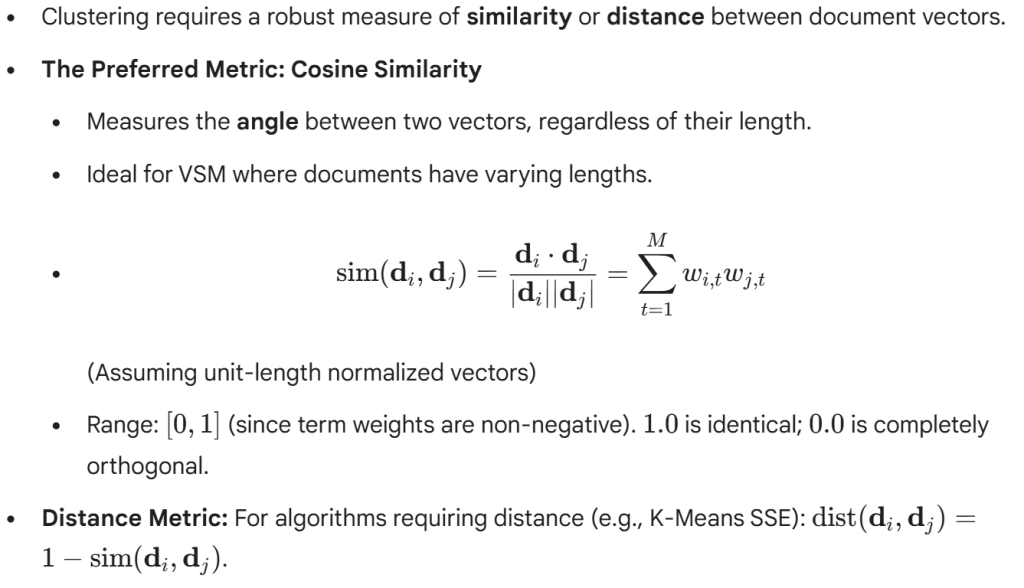
Measuring Document Similarity
Types of Clustering Structures
Clustering methods can be broadly categorized based on the structure of the resulting partition:
1. Partitional (Flat) Clustering:
- Creates a single level of K non-overlapping, exhaustive clusters.
- Every document belongs to exactly one cluster.
- Requires specifying the number of clusters Ka priori.
- Algorithms:K-Means, EM (Expectation-Maximization).
2. Hierarchical Clustering:
- Creates a nested sequence of partitions, organized into a tree structure called a Dendrogram.
- Does notrequire specifying K. The final partition is chosen by cutting the dendrogramat a specific level.
- Algorithms:Agglomerative (Bottom-Up)and Divisive (Top-Down).
Partitional Clustering: K-Means Introduction
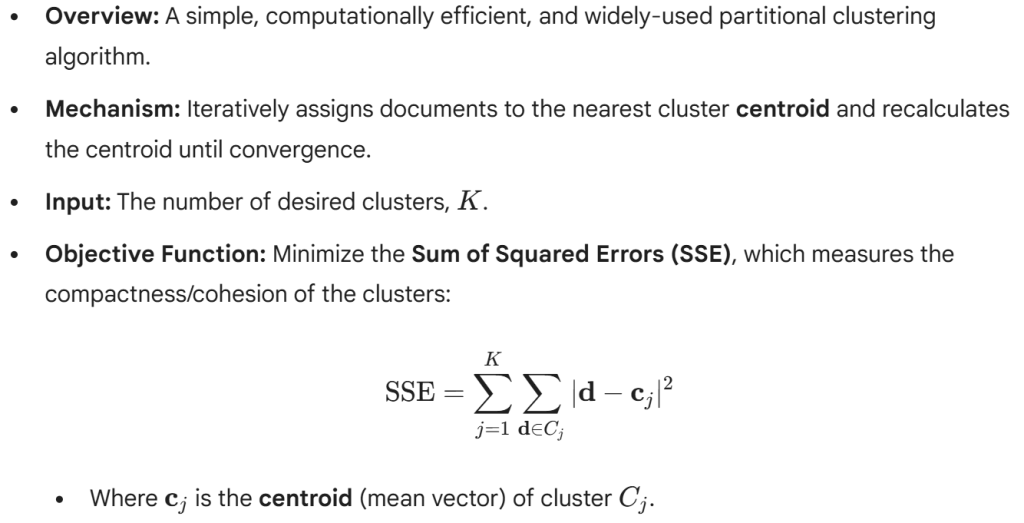
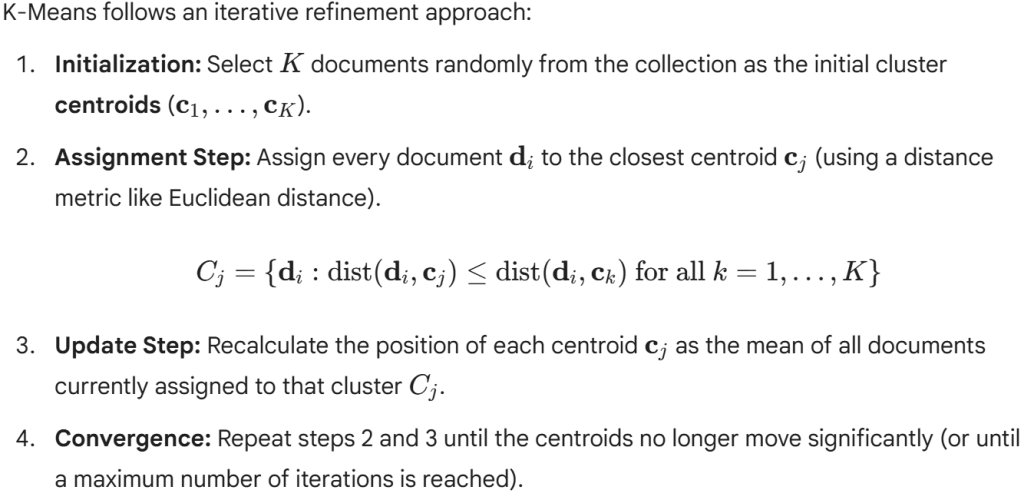
The K-Means Algorithm Steps
Challenges in K-Means Clustering
While fast and simple, K-Means has significant drawbacks, especially in the context of high-dimensional IR data:
1. Sensitivity to Initial Centroids:The final clustering result often depends heavily on the initial random selection of Kcentroids. Poor initialization can lead to a locally optimal but globally suboptimal solution (high SSE).
- SSE = sum of squared distances between each point and its assigned cluster centroid.
- High SSE → clusters are not tight, points are far from their centroids → poor clustering quality.
- Mitigation:Use more sophisticated initialization methods like K-Means++.
2. Requirement to Pre-specify K:There is no a priorimethod to determine the “correct” number of clusters, K.
•Mitigation:Use techniques like the Elbow Methodor Silhouette Analysis.
3. Assumes Spherical Clusters:K-Means minimizes squared Euclidean distance, inherently assuming clusters are convex and roughly spherical (isotropicallydistributed). It struggles with irregularly shaped or intertwined clusters.
4. Outlier Sensitivity:Centroids are the mean of the data points, making them highly sensitive to outliers, which can significantly skew the cluster center.
Hierarchical Clustering: Introduction
•Concept:Creates a nested sequence of clusters, resulting in a tree-like structure known as a Dendrogram.
•Advantage:Does not require specifying the number of clusters (K) beforehand. The resulting clusters are viewed at various levels of granularity by “cutting” the dendrogram.
•Two Main Approaches:
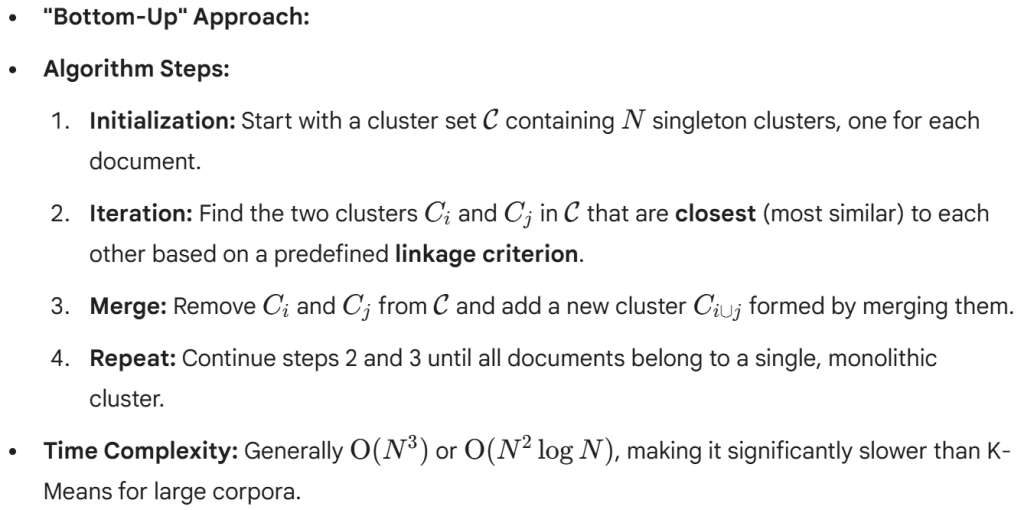
- Agglomerative (Bottom-Up):Starts with individual documents as clusters and merges the most similar clusters iteratively.
- Divisive (Top-Down):Starts with all documents in one cluster and recursively splits the cluster into two until only individual documents remain.
Agglomerative Hierarchical Clustering (HAC)
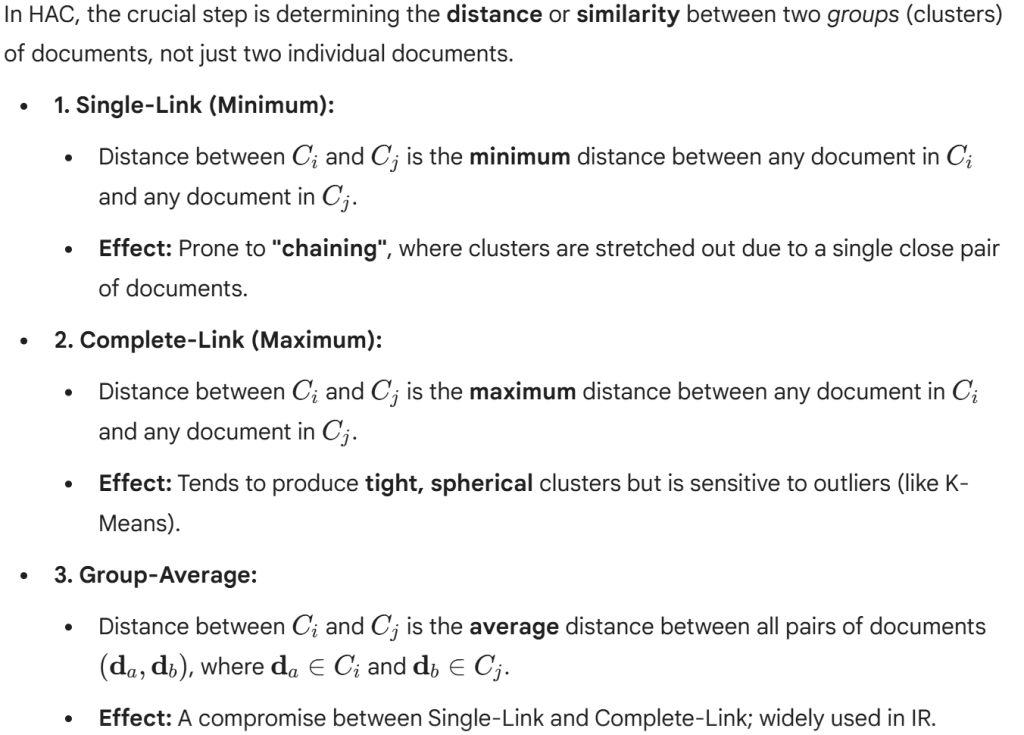
Defining Cluster Proximity: Linkage Criteria
The Dendrogram
•Visualization Tool:The Dendrogramvisually represents the entire history of merges (in HAC) or splits (in Divisive) that created the hierarchy.
•Interpretation:
•X-axis:Represents the documents.
•Y-axis:Represents the distance/dissimilarity(or time/iteration step) at which the merges occurred.
•Determining K:To obtain Kflat clusters, one “cuts” the dendrogramhorizontally at a height that intersects exactly Kvertical lines. Clusters joined at lower heights are more similar.
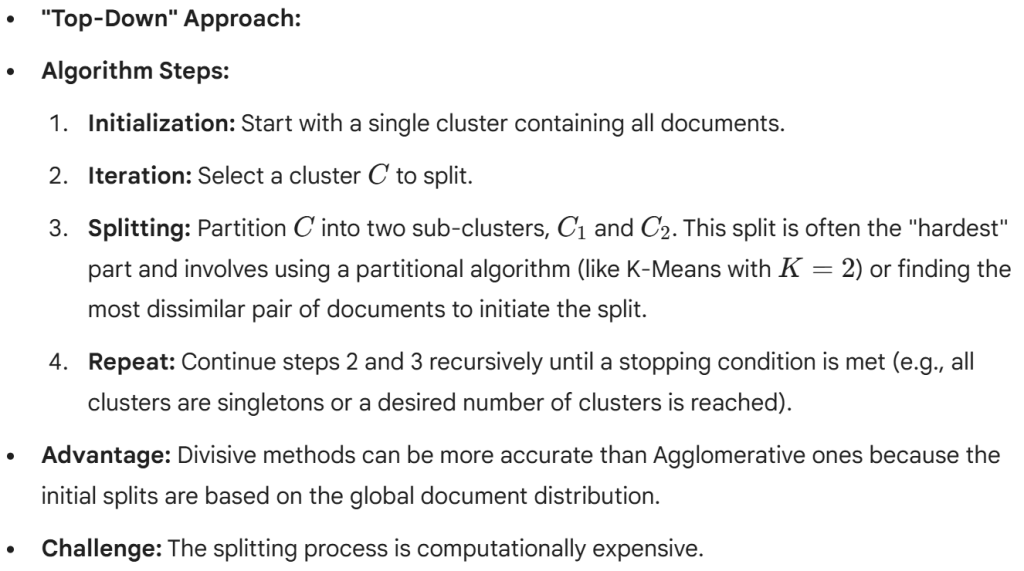
Divisive Hierarchical Clustering (DHC)
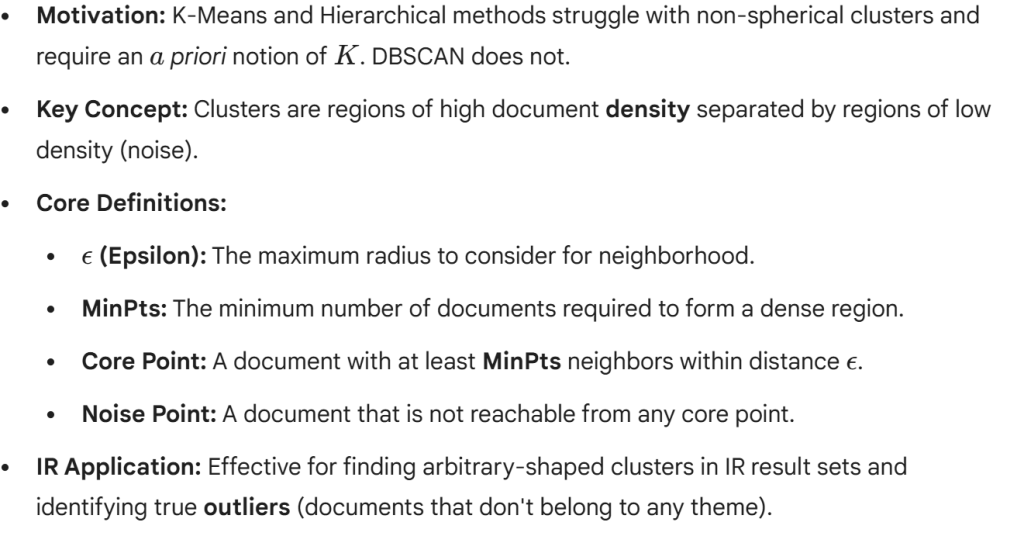
Density-Based Clustering (DBSCAN)
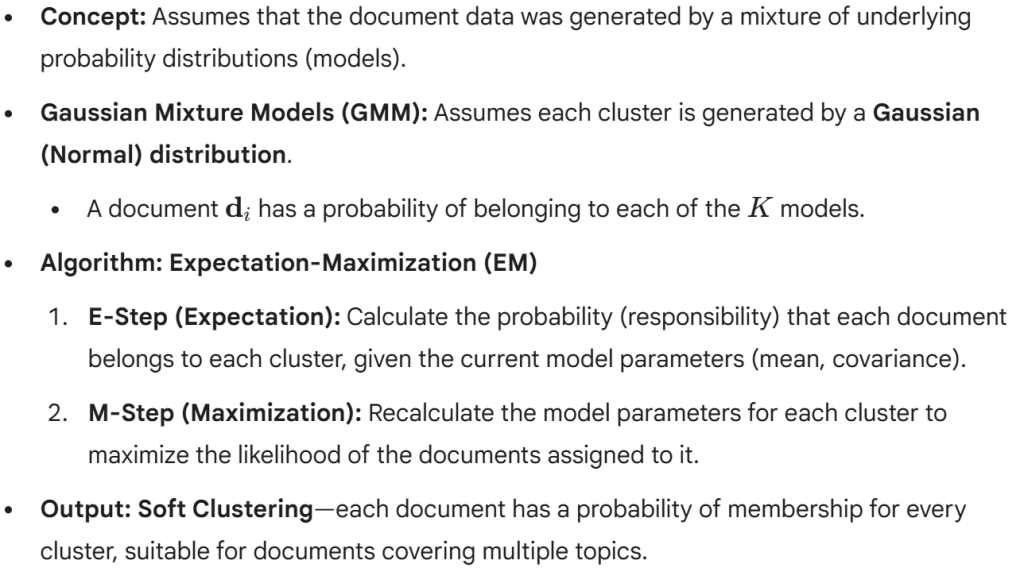
Model-Based Clustering (GMM)
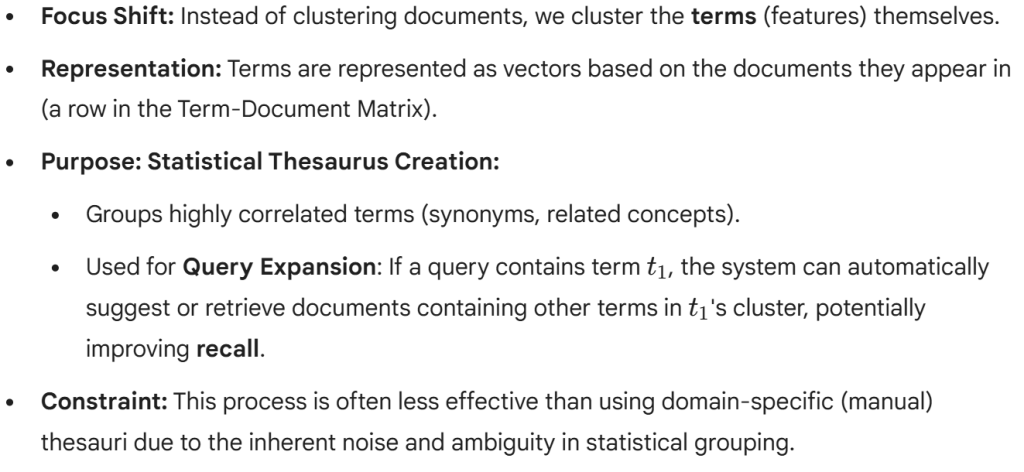
Clustering of Terms
Dimensionality Reduction for Clustering
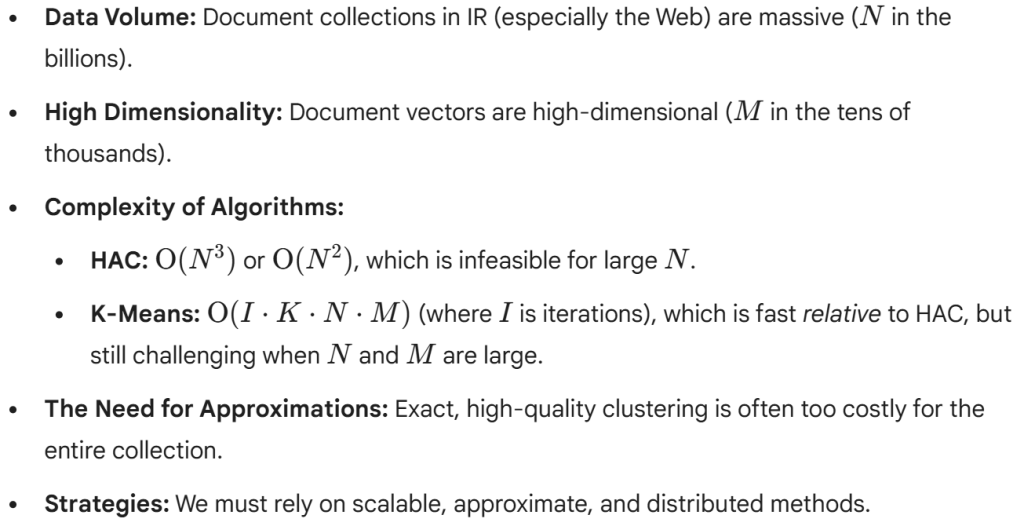
•Document vectors are extremely high-dimensional (vocabulary size M is typically tens of thousands). This presents a challenge:
•The Curse of Dimensionality:In high dimensions, all distances tend to become equal, making the concept of “nearness” and “farness” less meaningful for clustering.
•Computational Cost:Clustering algorithms slow down considerably as Mincreases.
•Common Techniques:
•1. Latent Semantic Indexing (LSI) / Singular Value Decomposition (SVD):Decomposes the Term-Document matrix to project data into a lower-dimensional latent space (k ≈ 300).
•2. Principal Component Analysis (PCA):Finds the directions (components) in the data that account for the most variance.
•Goal:Preserve the underlying cluster structure while removing noise and improving computational efficiency.
Scalability Challenges in IR Clustering
Scalability Solutions: Sampling and Bisection
•1. Random Sampling:
•Cluster only a representative sampleof the documents (e.g., 1% of the corpus).
•Use the resulting centroids/structure to guide the assignment of the remaining 99%.
•Risk:The sample may not perfectly capture the true distribution of topics.
•2. Bisecting K-Means:
•A hybrid approach blending partitionaland divisive hierarchical concepts.
•Method:Start with one cluster containing all documents. In each step, choose a cluster to split and use K-Means with K=2to divide it into two sub-clusters.
•Advantage:Faster than traditional K-Means because it runs K-Means on smaller subsets, and it is deterministic (produces a single hierarchy).
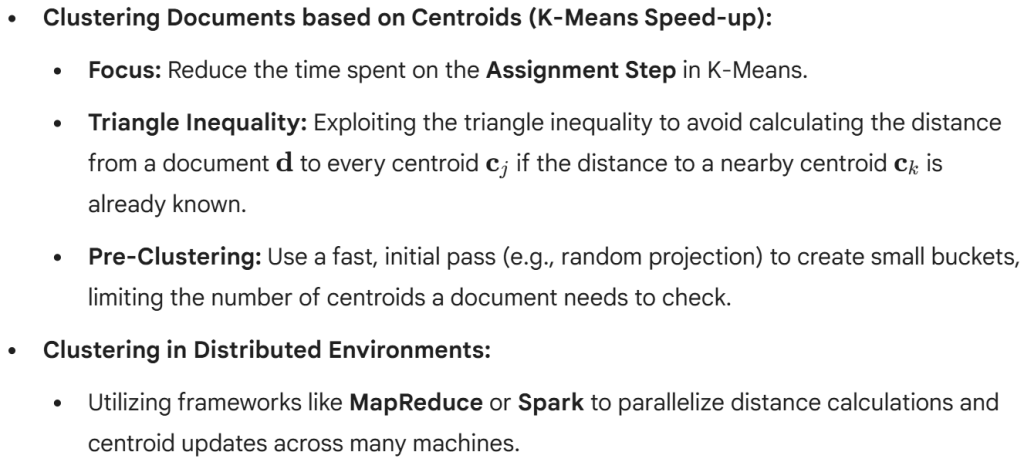
Scalability Solutions: Centroid-Based Optimization
Soft Clustering and Multilingual IR
•Soft (Fuzzy) Clustering:Documents are assigned a degree of membership(a probability or weight) to everycluster.
•Benefit in IR:A document covering multiple topics (e.g., “AI ethics and law”) is appropriately represented in both the “AI” and “Law” clusters.
•Common Algorithm:Expectation-Maximization (EM) for Gaussian Mixture Models (GMMs).
•Multilingual Clustering:
•Documents in different languages covering the same topic should cluster together.
•Requirement:Needs a language-independent representation, such as Cross-Lingual LSI (CL-LSI) or machine translation to a single intermediary language
Application I: Search Result Clustering (SRC)
•Type:Post-Retrieval Clustering
•Process:The system first executes the query using a standard ranking model (e.g., BM25) and retrieves the top Ndocuments (N ≈50-200). It then clusters only this small result set.
•User Benefit:Improves the browsingexperience. Instead of a long ranked list, the user sees a few meaningful cluster labels.
•Challenges:
•Speed:Must be executed in real-time(milliseconds) to avoid user latency. Requires very fast algorithms.
•Labeling:Clusters must be accurately and concisely labeledusing terms extracted from the cluster documents (e.g., using phrases or named entities).
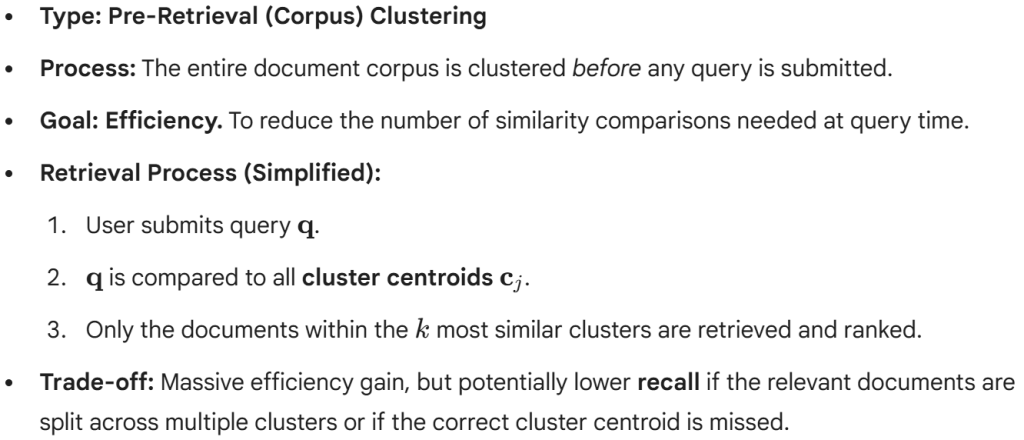
Application II: Pre-Retrieval Clustering (Corpus-Based)
The Cluster Labeling Problem
•Crucial for SRC:A cluster is useless to a user without a descriptive, human-readable label.
•Goal:Generate a short phrase (2–4 words) that accurately summarizes the topic of all documents in the cluster.
•Methods:
•1. Centroid Terms:Use the terms with the highest weight (TF-IDF) in the cluster centroid vector.
•2. Frequent Phrases:Extract frequent, non-stop-word phrases (N-grams) that appear across the cluster documents.
•3. Named Entities:Utilize recognized names (people, organizations, locations) as labels.
•Filtering:Labels must be filtered to remove overly general or non
Determining the Optimal Number of Clusters (K)
The K Problem:Only some partitionalalgorithms (like K-Means) require Kas input. Choosing Kis non-trivial.
•1. Elbow Method:
•Plot the SSE(Sum of Squared Errors) against the number of clusters K.
•Rationale:As Kincreases, the SSE naturally drops. The optimal Kis often found at the “elbow”—where the rate of decrease dramatically slows down.
•2. Silhouette Analysis:
•Measures how similar a document is to its own cluster compared to other clusters.
•Goal:Maximize the average Silhouette Coefficientover all documents.
•3. Domain Knowledge:Sometimes, Kis fixed based on known categories or user interface constraints (e.g., “show 10 clusters”).
Evaluation of Clustering: Internal Metrics
•Concept:Assess the quality of the clustering structure withoutreference to external, pre-defined class labels. Based purely on the data and the distance metric.
•1. Cohesion (Intra-Cluster Similarity):
•Measures how tightly related the documents within a cluster are.
•Metrics:Average similarity of all documents to the cluster centroid (or the mean pairwise distance). We want high cohesion.
•2. Separation (Inter-Cluster Dissimilarity):
•Measures how distinct clusters are from each other.
•Metrics:Distance between cluster centroids (e.g., Euclidean distance). We want high separation.
•3. Silhouette Coefficient:Combines cohesion and separation into a single score.
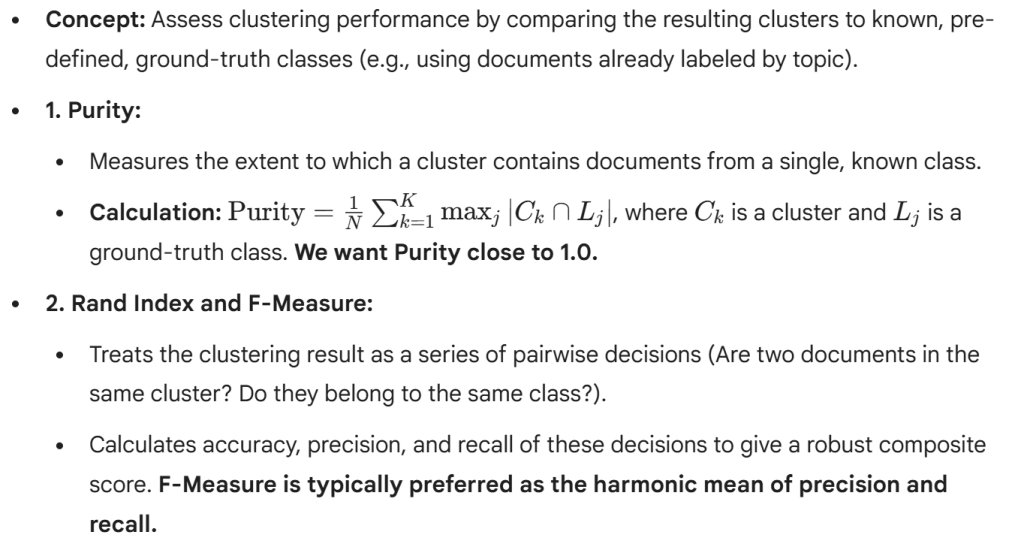
Evaluation of Clustering: External Metrics
Evaluation Pitfall: The Subjectivity of Clustering
•Clustering is Subjective:Unlike classification, there is no single, objective “correct” clustering for a dataset. Different goals require different clustering structures.
•For efficiency, a flat, coarse clustering (low K) might be best.
•For user browsing, a fine-grained, meaningful clustering (higher K) is better.
•Impact of Metrics:Internal metrics (cohesion/separation) and external metrics (purity/F-measure) may disagree.
•A clustering that optimizes Puritymight fail to be useful in a search interface if the clusters are too small or lack good labels.
•Conclusion:Clustering evaluation must consider the application contextand human judgment (user studies) alongside numerical
Improving Retrieval Effectiveness via Clustering
Case Study: Scatter/Gather Interface
•Concept:A user-driven interactive clustering interface for browsing large document collections.
•Steps:
1.The user selects an initial set of documents or submits a query.
2.The result set is quickly clustered (the Scatterstep).
3.The system presents the cluster labels and sizes.
4.The user selects one or more clusters to merge, refine, or drill down into (the Gatherstep).
5.The system re-clusters the gathered subset, repeating the process.
•Advantage:Provides an effective topical overview and allows the user to dynamically navigate the space without multiple query reformulations.
Clustering and Personalization
•User Profiles:Documents retrieved by a system are clustered based not just on content, but also on the user’s past interaction history.
•Method:Documents are weighted by a user-interest vector. Clustering then groups documents that are topically similar andrelevant to the user’s inferred interests.
•Application: News and Recommendation Systems:
•Grouping news articles by topic, then prioritizing clusters where the user has shown previous interest.
•Helps filter out irrelevant content and improve the perceived
Clustering as an Alternative to Indexing
•Inverted Indicesare the standard method for fast retrieval in IR.
•Clusteringoffers an alternative access structure.
•Comparison:
•Indexing:High Precision/High Recall. Comparison cost is O(query terms). Highly accurate.
•Clustering:Reduced Cost/Potentially Lower Recall. Comparison cost is O(number of clusters). Fast, but lossy.
•Hybrid Systems:The most common approach is to use clustering in conjunctionwith an inverted index—e.g., using clustering to find the
The Impact of Sparsity
•Sparsity:Document vectors are extremely sparse(most dimensions/terms have a zero weight) in IR.
•Consequence for Distance:Sparse vectors often have few co-occurring non-zero dimensions, leading to small or zero dot products (high Cosine Similarity if normalized, but the space is complex).
•Mitigation:
•Dimensionality Reduction (LSI):Creating dense vectors in a latent space mitigates the sparsity problem.
•Careful Metric Selection:Use metrics that handle high-dimensional sparsity well (like Cosine Similarity) over Euclidean distance.
Challenges: Noise and Outliers
•Noise:Documents that are short, contain little content, or have irrelevant content (e.g., boilerplate text, spam) can distort cluster centers.
•Outliers:Documents that are entirely dissimilar to the rest of the collection.
•K-Means Problem:Outliers can hijack a cluster centroid, pulling it away from the true cluster mean.
•DBSCAN Solution:Density-based methods, explicitly mark outliers as “noise” points that do not belong to any cluster, making the resulting clusters cleaner.
Summary: Clustering in IR
•Objective:Group similar documents to improve organization, user browsing, efficiency, and retrieval effectiveness (Recall).
•Foundation:The Cluster Hypothesis—similar documents are relevant to similar queries.
•Key Algorithms:
•K-Means:Fast, scalable, requires pre-defined K, assumes spherical clusters.
•Hierarchical (HAC/DHC):Creates a rich structural hierarchy (Dendrogram), more complex/slower.
•Evaluation:Requires both internal metrics(Cohesion/Separation) and external metrics(Purity/F-Measure) relative to the final application goal.
Future Directions in IR Clustering
•1. Dynamic and Streaming Clustering:
•Clustering documents (e.g., news feeds, social media posts) that arrive continuously and rapidly. The cluster structure must be maintained without re-clustering the entire history.
•2. Integrated Topic Modeling:
•Moving beyond traditional geometric clustering by using probabilistic models(like Latent DirichletAllocation -LDA) to define clusters based on latent topics, leading to more semantically meaningful cluster labels.
•3. GPU-Accelerated Clustering:
•Leveraging parallel processing hardware to achieve real-time clustering performance necessary for high-volume, real-time web search result organization.
Conclusion
•Clustering is a vital component of modern Information Retrieval systems, transforming vast, undifferentiated document collections into organized, navigable topical structures.
•Key Takeaway:The choice of clustering algorithm, similarity metric, and evaluation method must always be dictated by the specific IR goal: efficiency, effectiveness, or user experience.
Recommender Systems
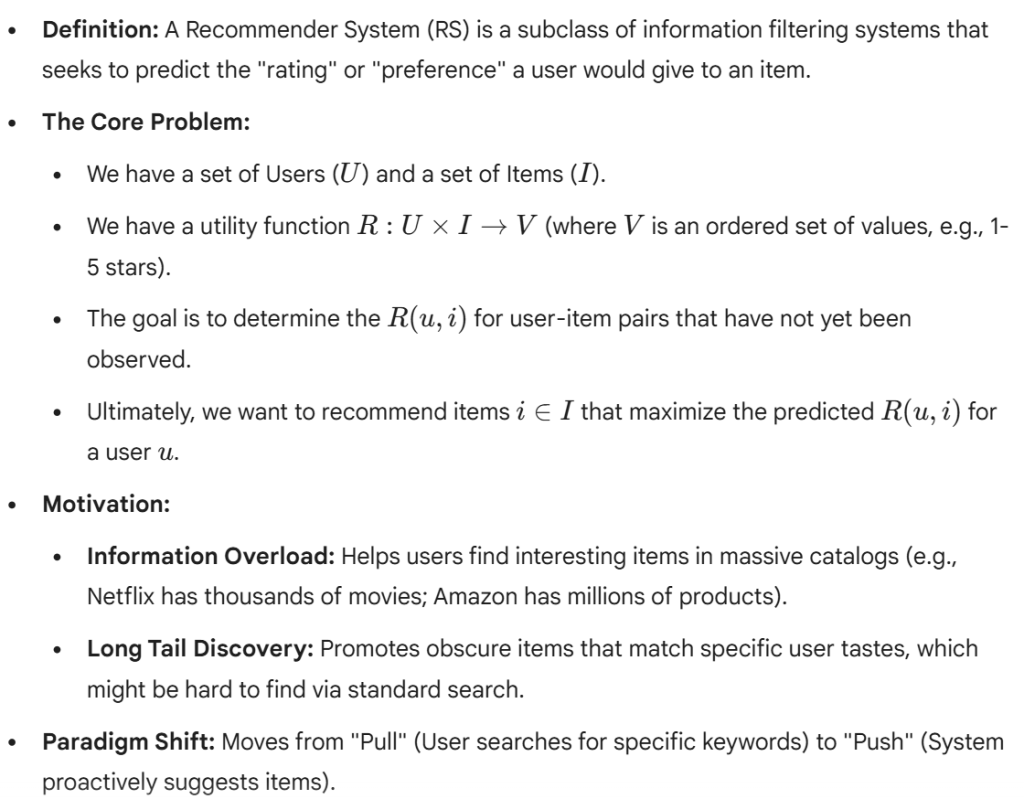
Introduction to Recommender Systems
Types of Feedback and Data
•Explicit Feedback:
•Direct input from users regarding their interest in items.
•Examples:Star ratings (1-5 stars on Amazon), Like/Dislike (YouTube), Numerical scores.
•Pros:High precision; clear signal of user preference.
•Cons:Sparse data (users rarely rate); reporting bias (users usually rate only things they love or hate).
•Implicit Feedback:
•Inferences made from user behavior.
•Examples:Purchase history, video watch time, page views, click-through rate, listening history (Spotify).
•Pros:Abundant data; no extra effort required from the user.
•Cons:Noisy data (a click doesn’t guarantee satisfaction); binary interpretation (interacted vs. didn’t interact) is often required.
•The Utility Matrix:
•The central data structure is a matrix with Users as rows and Items as columns.
•The matrix is extremely sparse(often >99% empty). The goal of RS is effectively “Matrix Completion.”
Taxonomy of Recommendation Approaches
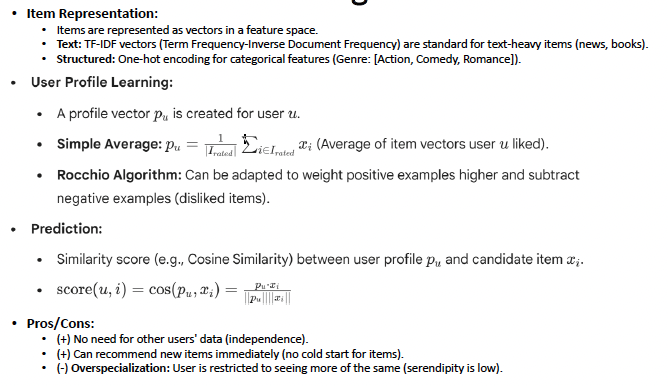
•1. Content-Based Filtering (CBF):
•Recommends items similar to those the user Liked in the past.
•Relies on Item Features(keywords, genre, director, etc.) and a User Profilebuilt from those features.
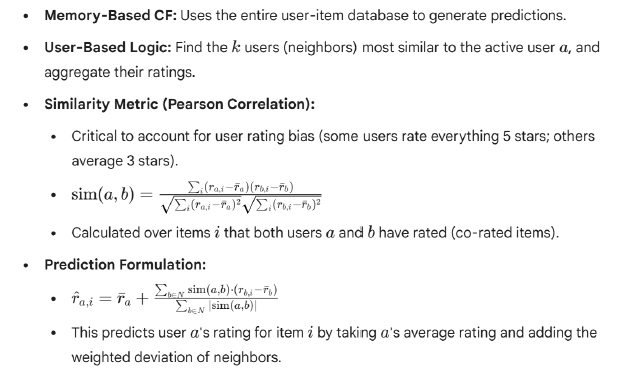
•2. Collaborative Filtering (CF):
•Recommends items based on the preferences of similar users.
•Relies on the Interaction Matrix(ratings/behavior) rather than item metadata.
•Key Idea:“Users who agreed in the past will agree in the future.”
•3. Hybrid Methods:
•Combines CBF and CF to overcome limitations like the Cold Start problem.
•4. Knowledge-Based:
•Uses explicit domain knowledge and requirements (e.g., “I need a laptop with 16GB RAM for under $1000”). Common in complex domains like real estate or electronics.
Content-Based Filtering: Mechanics
Collaborative Filtering: User-Based
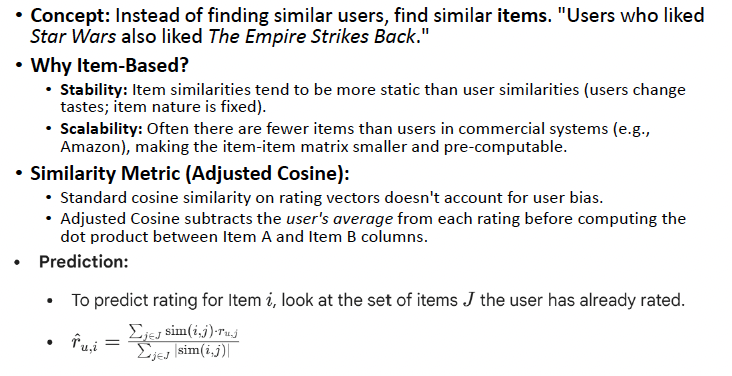
Collaborative Filtering: Item-Based
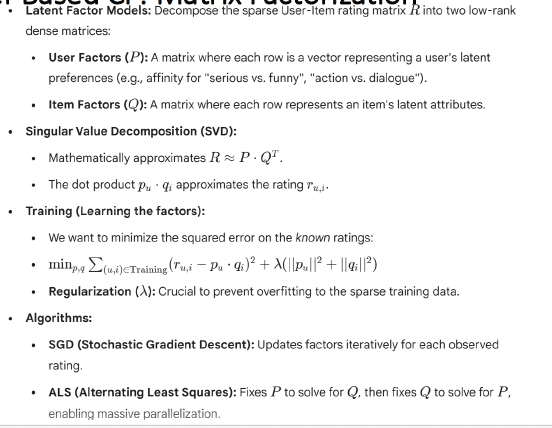
Model-Based CF: Matrix Factorization
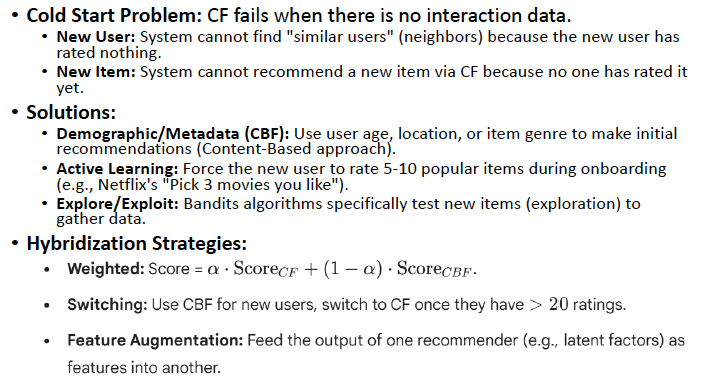
The Cold Start Problem & Hybridization
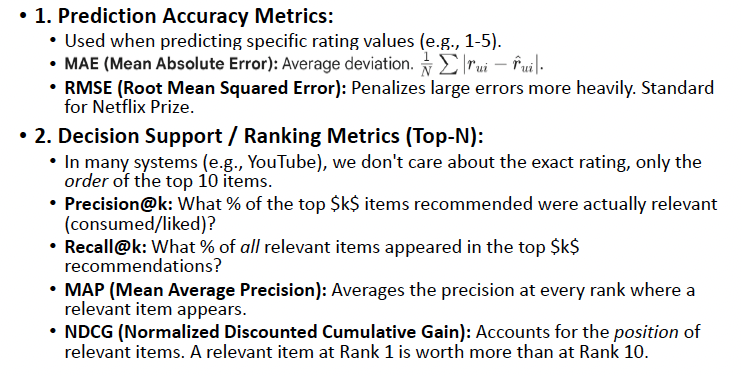
Evaluation Metrics (Prediction vs. Ranking)
Challenges and Advanced Topics
•Scalability:
•Real-world systems have millions of users and items. O(N2) neighbor calculations are too slow.
•Solutions:Clustering, Dimensionality Reduction (SVD), Approximate Nearest Neighbors (ANN) searching (e.g., Faiss).
•Data Sparsity:
•When the interaction matrix is < 0.1% full, finding overlaps between users is difficult.
•Solutions:Matrix Factorization, implicating trust networks (Trust-aware Recommenders).
•The “Filter Bubble”:
•System keeps recommending what the user already agrees with/likes, reducing diversity.
•Evaluation:Need metrics for Novelty(recommending unknown items) and Serendipity(recommending surprisingly interesting items).
•Shilling Attacks:
•Malicious users creating fake profiles to rate items highly (push attacks) or poorly (nuke attacks) to manipulate the system.
•Robustness:Designing algorithms resistant to outliers and fake profiles.